CMO Best Settings for 30m: Default vs Top Settings Backtested (Fees Included)
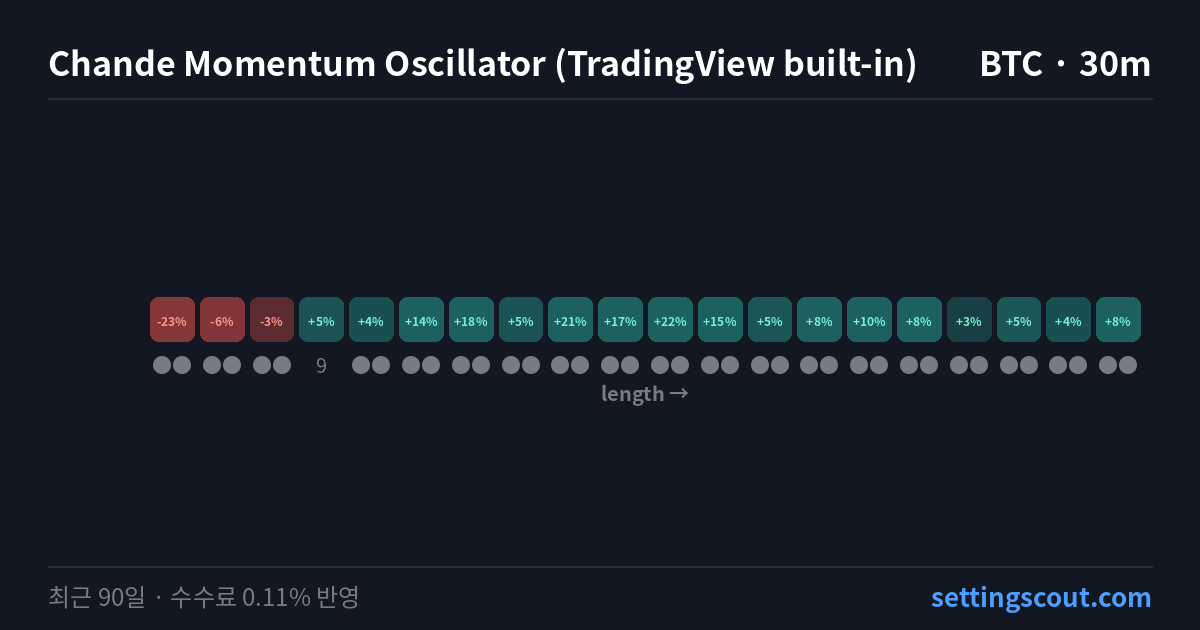
Say you put CMO (Chande Momentum Oscillator) on your chart and traded every signal for the last 90 days. Here is how the default 9 did, side by side with every other setting combination under the same conditions. We ran all 800 setting combinations on 10 coins (BTC, ETH, SOL, XRP, BNB, DOGE, ADA, LINK, SUI and HYPE) across 15m, 30m, 1h and 4h, with a 0.11% fee taken out of every trade. The figures in this post are as of 2026-10-30, and every result is recomputed nightly with fresh data.
How does CMO work?
The Chande Momentum Oscillator (CMO), developed by Tushar Chande, is a momentum indicator that swings between -100 and +100. Over the lookback it adds up the closing-price gains and the losses separately, takes the difference between the two sums, divides by their total and multiplies by 100. When gains dominate it approaches +100; when losses dominate it approaches -100.
It uses much the same ingredients as RSI, but CMO sums gains and losses without smoothing and is symmetric around zero, which makes the direction and strength of momentum easy to read directly. The usual convention treats readings above +50 as overbought and below -50 as oversold, and a move out of oversold or down out of overbought is taken as a sign the swing is turning.
What do the CMO inputs mean?
- Length (length) — Number of bars over which gains and losses are summed. Default 9
TradingView default: 9. Backtest rule used here: Long only. Enter when CMO crosses above -50 (oversold line) and exit when it crosses below +50 (overbought line), judged at bar close and filled at the next bar's open.
What happens if you keep the default?
Coin by coin on 30m, the default 9 topped out on BTC at —%, with 0 coins in the green. On the same 30m, the top setting combination reached +79.84%, versus a default average of —% — a 79.8-point gap that shows how wide the range of outcomes is.
From 15m to 4h — where did the difference come from?
| Timeframe | Default avg. return | Positive settings | Avg. trades |
|---|---|---|---|
| 15m | —% | 62% | 91 |
| 30m | —% | 68% | 46 |
| 1h | —% | 66% | 23 |
| 4h | —% | 51% | 6 |
The shorter the timeframe, the more trades — and the more the 0.11% fee per trade ate into results. 30m had the highest positive share at 68%. 4h averaged 6 trades, so fees alone took about 0.6 points; 30m averaged 46 trades and about 5.0 points.
Which coins did it fit?
Results of the default 9 on 30m for each coin, with the positive share across all setting combinations.
| Coin | Return | Win rate | MDD | Trades | Positive settings |
|---|---|---|---|---|---|
| BTC | —% | — | — | — | 85% |
| ETH | —% | — | — | — | 85% |
| SOL | —% | — | — | — | 80% |
| XRP | —% | — | — | — | 35% |
| BNB | —% | — | — | — | 80% |
| DOGE | —% | — | — | — | 80% |
| ADA | —% | — | — | — | 40% |
| LINK | —% | — | — | — | 60% |
| SUI | —% | — | — | — | 70% |
| HYPE | —% | — | — | — | 65% |
BTC came first with the default; 0 coins ended below zero. The same indicator behaved differently from coin to coin.
How far did the top settings go?
The three strongest results on 30m.
- SUI 30m: +79.84% — settings are 🔒 unlocked in PRO
- HYPE 30m: +52.01% — settings are 🔒 unlocked in PRO
- ADA 30m: +42.22% — settings are 🔒 unlocked in PRO
One high result on its own can be a short lucky streak. The indicator analysis page shows whether nearby setting combinations held up too.
What to keep in mind when reading the numbers
This is one 90-day window. A low win rate can still come with a positive return, and a large MDD means a deep drawdown had to be sat through along the way. Return, MDD and trade count are best read together.
CMO FAQ
How is it different from RSI?
Both use gains and losses, but CMO sums them without smoothing and runs from -100 to +100 around zero, so its swings tend to look sharper than RSI's.
Where are the overbought and oversold lines?
The backtest here fixes overbought at +50 and oversold at -50. The only input that varies is length.
Are the rules the same as the original?
The indicator math follows TradingView's built-in indicator. Entries, exits and fills use the settingscout standard: signals at bar close, fills at the next open, per-trade fee included.
In short
In this data, CMO had its highest positive share on 30m at 68%, and the TradingView default (9) was positive on 0 of 10 coins. On the same 30m, the gap between the top setting combination and the default average was 79.8 points.
Method: past 90 days · 0.11% fee per trade · fills at the next bar's open after the signal · Methodology
Related posts
- CMF Best Settings for 4h: Default vs Top Settings Backtested (Fees Included)
- CCI Best Settings for 4h: Default vs Top Settings Backtested (Fees Included)
- BBP Best Settings for 4h: Default vs Top Settings Backtested (Fees Included)
- Coppock Curve Best Settings for 4h: Default vs Top Settings Backtested (Fees Included)
More CMO posts · More 30m posts
Open the free CMO indicator analysis (BTC 30m) →
Past 90-day results, 0.11% fee per trade included, not a prediction.


Comments
Post a Comment