BB Best Settings for 4h: Default vs Top Settings Backtested (Fees Included)
BB (Bollinger Bands) behaved very differently by timeframe. Over the past 90 days, 90% of setting combinations finished positive after fees on 4h, but only 11% did on 15m. We ran all 1,400 setting combinations on 10 coins (BTC, ETH, SOL, XRP, BNB, DOGE, ADA, LINK, SUI and HYPE) across 15m, 30m, 1h and 4h, with a 0.11% fee taken out of every trade. The figures in this post are as of 2026-10-17, and every result is recomputed nightly with fresh data.
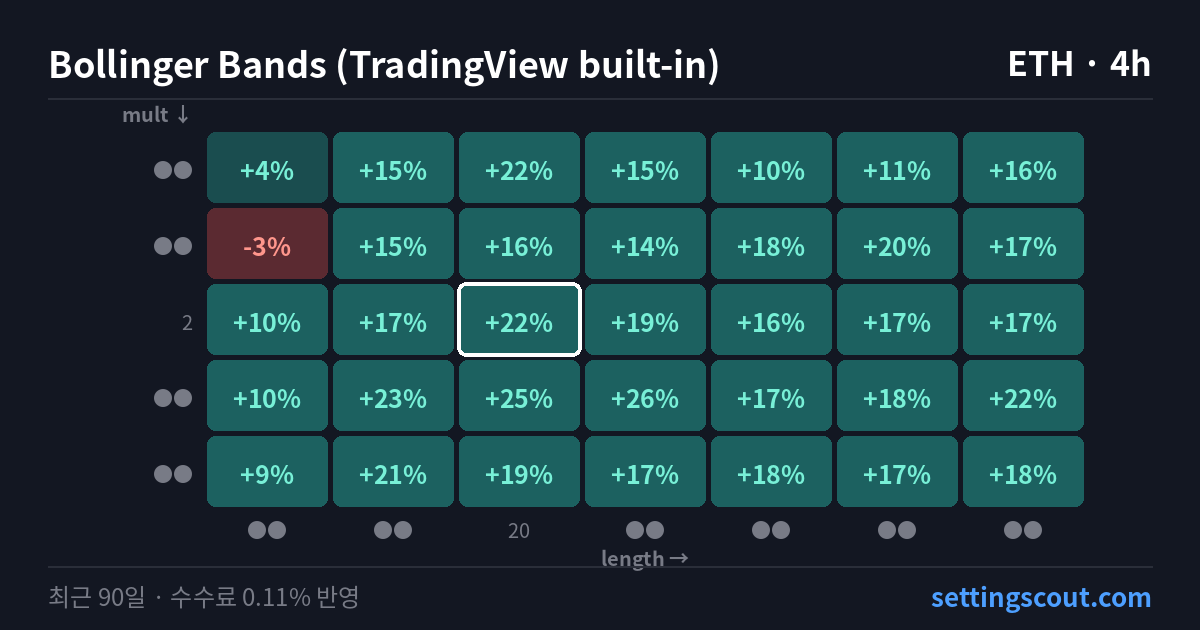
What does BB actually measure?
Bollinger Bands (BB) are a volatility tool developed by John Bollinger. The middle line is a simple moving average of the close, and the upper and lower bands sit a multiple of the standard deviation of the close above and below it. TradingView's defaults are a length of 20 and a multiplier of 2. The bands widen when volatility rises and tighten when the market calms down.
A touch of the lower band means price has stretched further below its recent average than usual. That makes it a common trigger for mean-reversion setups that look for a move back toward the middle line. In a strong trend, though, price can ride along a band for a long time (a "band walk"), so many traders read the touch together with the width of the bands.
How should you read the BB parameters?
- Length (length) — Number of bars used for the middle line (SMA of the close) and the standard deviation. Default is 20.
- StdDev multiplier (mult) — How many standard deviations the upper and lower bands sit from the middle line. Default is 2; a larger value makes the bands wider.
TradingView default: 20 · 2. Backtest rule used here: When a bar closes with its low at or below the lower band, a long position is opened at the next bar's open; when a bar closes at or above the middle line, the position is closed at the next bar's open. Long only.
How does the TradingView default perform?
Applied as-is on 4h, the default 20 · 2 was positive on 10 of 10 coins; ETH led at +20.86%. Put the default average (+8.84%) next to the top setting combination (+32.92%) and 4h alone shows a 24.1-point spread.
Which timeframe fit best?
| Timeframe | Default avg. return | Positive settings | Avg. trades |
|---|---|---|---|
| 15m | -11.94% | 11% | 285 |
| 30m | -9.16% | 17% | 145 |
| 1h | -0.80% | 56% | 74 |
| 4h | +8.84% | 90% | 19 |
4h came in at 90% positive versus 11% on 15m — a clear split by timeframe. 15m averaged 285 trades, so fees alone took about 31.3 points; 4h averaged 19 trades and about 2.0 points.
How does it look by coin?
Below: the default 20 · 2 on 4h, plus the share of all setting combinations on each coin that ended positive after fees.
| Coin | Return | Win rate | MDD | Trades | Positive settings |
|---|---|---|---|---|---|
| ETH | +20.86% | 73.7% | -7.92% | 19 | 97% |
| LINK | +12.76% | 68.4% | -11.41% | 19 | 97% |
| HYPE | +11.51% | 62.5% | -8.64% | 16 | 97% |
| SOL | +8.67% | 72.2% | -12.72% | 18 | 91% |
| SUI | +8.14% | 61.1% | -14.13% | 18 | 63% |
| BNB | +7.61% | 68.8% | -6.80% | 16 | 100% |
| ADA | +6.65% | 60.0% | -18.21% | 15 | 77% |
| XRP | +5.61% | 57.9% | -10.94% | 19 | 91% |
| BTC | +5.47% | 65.0% | -4.72% | 20 | 100% |
| DOGE | +1.14% | 60.0% | -13.20% | 20 | 89% |
By coin, ETH led, and the default finished negative on 0 coins.
Top results on 4h
Returns of the top three setting combinations on 4h.
- LINK 4h: +32.92% — settings are 🔒 unlocked in PRO
- ADA 4h: +31.14% — settings are 🔒 unlocked in PRO
- HYPE 4h: +27.23% — settings are 🔒 unlocked in PRO
One high result on its own can be a short lucky streak. The indicator analysis page shows whether nearby setting combinations held up too.
What else should you look at besides return?
The figures are past results after a 0.11% fee per trade. Two equal returns can feel completely different with different trade counts and MDD. The numbers are recomputed every night.
FAQ
Is the lower-band touch judged by the low or the close?
By the low. An entry is triggered when a closed bar's low reaches or breaks the lower band, even if the bar closes back inside the bands.
Why exit at the middle line instead of the upper band?
This backtest looks at price snapping back toward its average after stretching to the lower band, so the middle line, which is the average itself, is the exit level. Once a bar closes at or above it, the trade is closed at the next open.
Does it add to the position on another touch?
No. Only one position is held at a time, and touches that happen while it is open are ignored. A new entry needs a fresh touch after the previous trade has closed.
In short
In this data, BB had its highest positive share on 4h at 90%, and the TradingView default (20 · 2) was positive on 10 of 10 coins. On the same 4h, the gap between the top setting combination and the default average was 24.1 points.
Method: past 90 days · 0.11% fee per trade · fills at the next bar's open after the signal · Methodology
Related posts
- Aroon Best Settings for 4h: Default vs Top Settings Backtested (Fees Included)
- Arnaud Legoux Moving Average (TradingView built-in) default setting: 16 setting combinations did better on BTC 4h
- This Week's Most Improved TradingView Strategies: Top 5 (4h)
- BBP Best Settings for 4h: Default vs Top Settings Backtested (Fees Included)
See every BB setting combination on ETH 4h →
Past 90-day results, 0.11% fee per trade included, not a prediction.


Comments
Post a Comment