Aroon Best Settings for 4h: Default vs Top Settings Backtested (Fees Included)
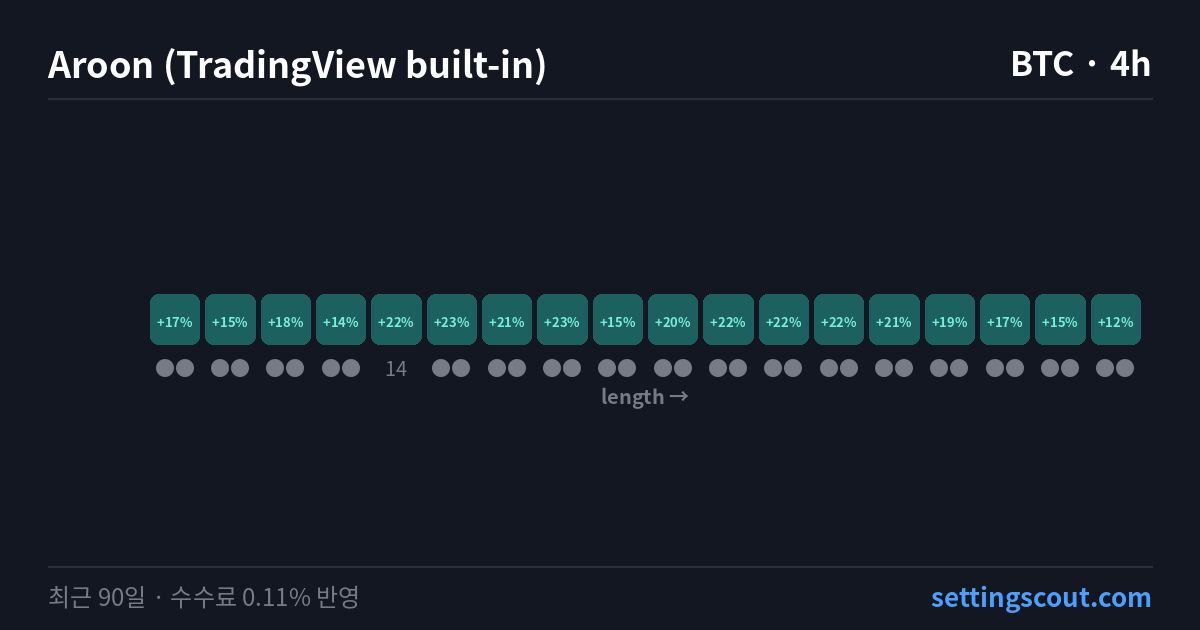
Is the default Aroon (Aroon Indicator) good enough? TradingView loads Aroon with 14 out of the box, so we checked how those exact inputs held up in the latest market. We ran all 720 setting combinations on 10 coins (BTC, ETH, SOL, XRP, BNB, DOGE, ADA, LINK, SUI and HYPE) across 15m, 30m, 1h and 4h, with a 0.11% fee taken out of every trade. The figures in this post are as of 2026-10-16, and every result is recomputed nightly with fresh data.
What is Aroon?
Aroon is a trend indicator developed by Tushar Chande; the name comes from the Sanskrit word for "dawn's early light." Within a lookback window it counts how many bars have passed since the highest high and since the lowest low, producing two lines: Aroon Up and Aroon Down. If the high was just made, Aroon Up sits at the top of its range; the older the high, the lower the line.
Both lines are expressed as percentages. A high Aroon Up with a low Aroon Down points to an uptrend where fresh highs keep coming, and the reverse points to a downtrend. When both lines stay low, the market is usually moving sideways without a clear direction. Because Aroon measures time rather than price distance, it is often used to spot the moment a new trend begins.
What does each Aroon setting change?
- Length (length) — Number of bars searched for the highest high and lowest low. Default is 14. TradingView looks at the current bar plus that many bars back.
TradingView default: 14. Backtest rule used here: When a bar closes with Aroon Up crossing above Aroon Down, a long position is opened at the next bar's open; when a bar closes with Up crossing below Down, it is closed at the next bar's open. Long only.
How did the default 14 do?
On 4h, the default 14 did best on BTC at —%, and finished positive after fees on 0 of 10 coins. On 4h, the default averaged —% while the strongest setting combination under the same conditions hit +56.92%: a 56.9-point difference.
How much does the timeframe matter?
| Timeframe | Default avg. return | Positive settings | Avg. trades |
|---|---|---|---|
| 15m | —% | 18% | 262 |
| 30m | —% | 63% | 130 |
| 1h | —% | 90% | 64 |
| 4h | —% | 98% | 16 |
The positive share peaked on 4h (98%) and bottomed on 15m (18%). More frequent trading meant a heavier fee drag. 15m averaged 262 trades, so fees alone took about 28.9 points; 4h averaged 16 trades and about 1.7 points.
Coin-by-coin results on 4h
All on 4h. Return, win rate, MDD and trades are for the default 14; the positive share covers every setting combination on that coin.
| Coin | Return | Win rate | MDD | Trades | Positive settings |
|---|---|---|---|---|---|
| BTC | —% | — | — | — | 100% |
| ETH | —% | — | — | — | 100% |
| SOL | —% | — | — | — | 100% |
| XRP | —% | — | — | — | 100% |
| BNB | —% | — | — | — | 100% |
| DOGE | —% | — | — | — | 83% |
| ADA | —% | — | — | — | 100% |
| LINK | —% | — | — | — | 100% |
| SUI | —% | — | — | — | 100% |
| HYPE | —% | — | — | — | 94% |
BTC was strongest, while 0 coins stayed negative on the default — the coin split is as visible as the timeframe split.
What did the highest setting combinations return?
The three highest-returning setting combinations on 4h.
- HYPE 4h: +56.92% — settings are 🔒 unlocked in PRO
- HYPE 4h: +53.16% — settings are 🔒 unlocked in PRO
- HYPE 4h: +52.71% — settings are 🔒 unlocked in PRO
One high result on its own can be a short lucky streak. The indicator analysis page shows whether nearby setting combinations held up too.
How should you read these results?
Return alone hides a lot. With few trades, a handful of big ones can decide the result, and MDD shows the deepest drop in the window. Everything here is past 90-day data and says nothing about what comes next.
Common questions
What happens if Aroon Up and Down are equal?
A cross only counts when one line actually moves past the other. While both lines sit at the same value, no entry or exit is triggered.
Is this the same as the Aroon Oscillator?
The Aroon Oscillator is a single line equal to Up minus Down. An Up/Down cross happens exactly when that oscillator passes through zero, so both views mark the same bars.
Why do the lines move in steps?
Aroon counts bars since the last high or low instead of measuring price size. Without a fresh high or low, each line drops by a fixed amount per bar, which gives it a stair-step shape.
In short
In this data, Aroon had its highest positive share on 4h at 98%, and the TradingView default (14) was positive on 0 of 10 coins. On the same 4h, the gap between the top setting combination and the default average was 56.9 points.
Method: past 90 days · 0.11% fee per trade · fills at the next bar's open after the signal · Methodology
Related posts
- Arnaud Legoux Moving Average (TradingView built-in) default setting: 16 setting combinations did better on BTC 4h
- Directional Movement Index (TradingView built-in) works best on 30m: 89% of settings positive on LINK (fees included)
- This Week's Most Improved TradingView Strategies: Top 5 (4h)
- BB Best Settings for 4h: Default vs Top Settings Backtested (Fees Included)
More Aroon posts · More 4h posts
See the full Aroon indicator analysis for BTC 4h →
Past 90-day results, 0.11% fee per trade included, not a prediction.


Comments
Post a Comment