BBP Best Settings for 4h: Default vs Top Settings Backtested (Fees Included)
Say you put BBP (Bull Bear Power) on your chart and traded every signal for the last 90 days. Here is how the default 13 did, side by side with every other setting combination under the same conditions. We ran all 760 setting combinations on 10 coins (BTC, ETH, SOL, XRP, BNB, DOGE, ADA, LINK, SUI and HYPE) across 15m, 30m, 1h and 4h, with a 0.11% fee taken out of every trade. The figures in this post are as of 2026-10-18, and every result is recomputed nightly with fresh data.
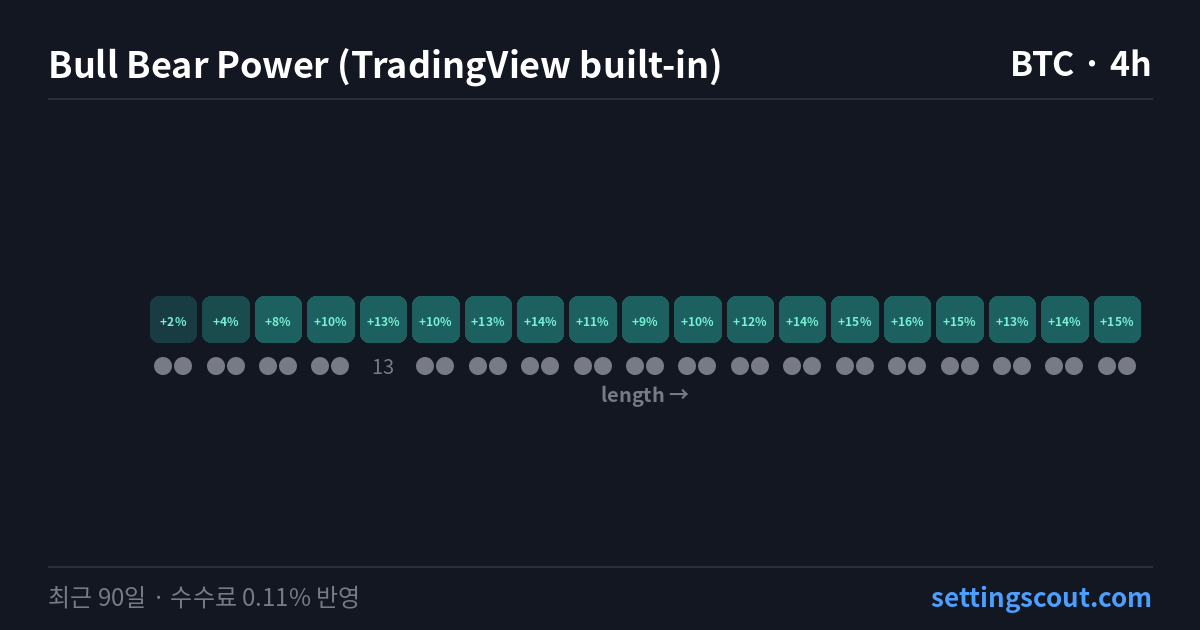
How does BBP work?
Bull Bear Power (BBP) is built on Alexander Elder's Elder-Ray Index. It uses an exponential moving average (EMA) of the close as a baseline: the high minus the EMA is Bull Power, and the low minus the EMA is Bear Power. TradingView's built-in BBP adds the two together and plots the sum as a histogram around a zero line.
A positive BBP means the bar's high and low lean above the average, so buyers have the upper hand; a negative value means sellers are in control. A zero-line cross is therefore read as the balance of power tipping from one side to the other. In Elder's original approach, the slope of the EMA is checked first to define the trend, and the two power readings are used as a supporting signal.
What do the BBP inputs mean?
- EMA length (length) — Number of bars in the EMA of the close used as the baseline. Default is 13. BBP is computed from the distance of the high and low to this EMA.
TradingView default: 13. Backtest rule used here: When a bar closes with BBP crossing above zero, a long position is opened at the next bar's open; when a bar closes with BBP crossing below zero, it is closed at the next bar's open. Long only.
What happens if you keep the default?
Coin by coin on 4h, the default 13 topped out on BTC at —%, with 0 coins in the green. On the same 4h, the top setting combination reached +58.13%, versus a default average of —% — a 58.1-point gap that shows how wide the range of outcomes is.
From 15m to 4h — where did the difference come from?
| Timeframe | Default avg. return | Positive settings | Avg. trades |
|---|---|---|---|
| 15m | —% | 0% | 561 |
| 30m | —% | 19% | 277 |
| 1h | —% | 67% | 138 |
| 4h | —% | 89% | 34 |
The shorter the timeframe, the more trades — and the more the 0.11% fee per trade ate into results. 4h had the highest positive share at 89%. 15m averaged 561 trades, so fees alone took about 61.7 points; 4h averaged 34 trades and about 3.7 points.
Which coins did it fit?
Results of the default 13 on 4h for each coin, with the positive share across all setting combinations.
| Coin | Return | Win rate | MDD | Trades | Positive settings |
|---|---|---|---|---|---|
| BTC | —% | — | — | — | 100% |
| ETH | —% | — | — | — | 100% |
| SOL | —% | — | — | — | 100% |
| XRP | —% | — | — | — | 100% |
| BNB | —% | — | — | — | 100% |
| DOGE | —% | — | — | — | 21% |
| ADA | —% | — | — | — | 95% |
| LINK | —% | — | — | — | 100% |
| SUI | —% | — | — | — | 100% |
| HYPE | —% | — | — | — | 79% |
BTC came first with the default; 0 coins ended below zero. The same indicator behaved differently from coin to coin.
How far did the top settings go?
The three strongest results on 4h.
- SUI 4h: +58.13% — settings are 🔒 unlocked in PRO
- SUI 4h: +57.93% — settings are 🔒 unlocked in PRO
- SUI 4h: +56.52% — settings are 🔒 unlocked in PRO
One high result on its own can be a short lucky streak. The indicator analysis page shows whether nearby setting combinations held up too.
What to keep in mind when reading the numbers
This is one 90-day window. A low win rate can still come with a positive return, and a large MDD means a deep drawdown had to be sat through along the way. Return, MDD and trade count are best read together.
BBP FAQ
Is BBP the same as Elder-Ray?
They use the same ingredients. Elder-Ray plots Bull Power and Bear Power as two separate series, while TradingView's BBP adds them and shows a single histogram.
What does a BBP of zero mean?
The high and low are the same distance from the EMA on opposite sides, so the middle of the bar sits right on the average. A zero-line cross is the moment the bar's midpoint moves across the EMA.
Why an exponential moving average?
Elder used an EMA in his original definition. An EMA gives more weight to recent prices, so it reacts faster than a simple average. TradingView's built-in BBP follows the same design.
In short
In this data, BBP had its highest positive share on 4h at 89%, and the TradingView default (13) was positive on 0 of 10 coins. On the same 4h, the gap between the top setting combination and the default average was 58.1 points.
Method: past 90 days · 0.11% fee per trade · fills at the next bar's open after the signal · Methodology
Related posts
- BB Best Settings for 4h: Default vs Top Settings Backtested (Fees Included)
- Aroon Best Settings for 4h: Default vs Top Settings Backtested (Fees Included)
- AO Best Settings for 1h: Default vs Top Settings Backtested (Fees Included)
- This Week's Most Improved TradingView Strategies: Top 5 (4h)
More BBP posts · More 4h posts
Open the free BBP indicator analysis (BTC 4h) →
Past 90-day results, 0.11% fee per trade included, not a prediction.


Comments
Post a Comment